cart on a ramp
It's a cart. On a ramp. It's not complicated enough to need a real introduction.
purpose
The purpose of this experiment was to collect and analyze position versus time, velocity versus time, and acceleration versus time graphs of the cart rolling up and down a ramp. We also did this experiment to determine the best fit equations for the distance versus time and velocity versus time graphs and to discover the mean acceleration.
materials & procedure
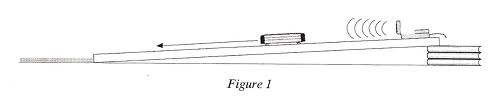
Step 1: Gather a low-friction cart, a Motion Detector, LabQuest, a ramp, a stopper to prevent the cart from falling off the ramp, and something to make the ramp inclined. The set-up should look something like this:
Step 2: Place the cart at the lower end of the ramp.
Step 3: Start the Motion Detector.
Step 4: GENTLY push the cart up the ramp. You only need to touch it for a second.
Step 5: Pay attention to how the cart moves while on the ramp. Then analyze your three graphs (position versus time, velocity versus time, and acceleration versus time) using LabQuest.
predictions, data, and analysis
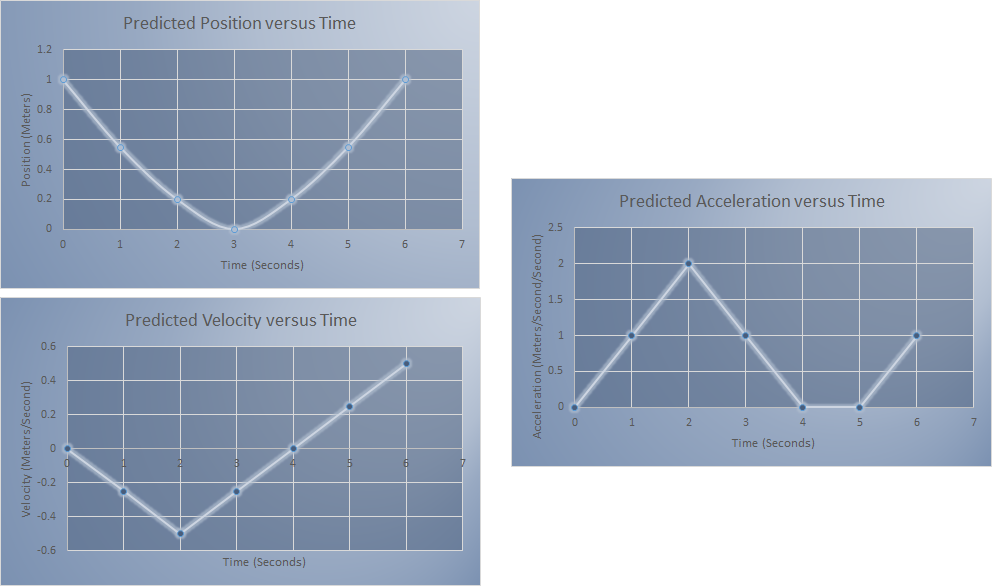
Here are the graphs I expected:
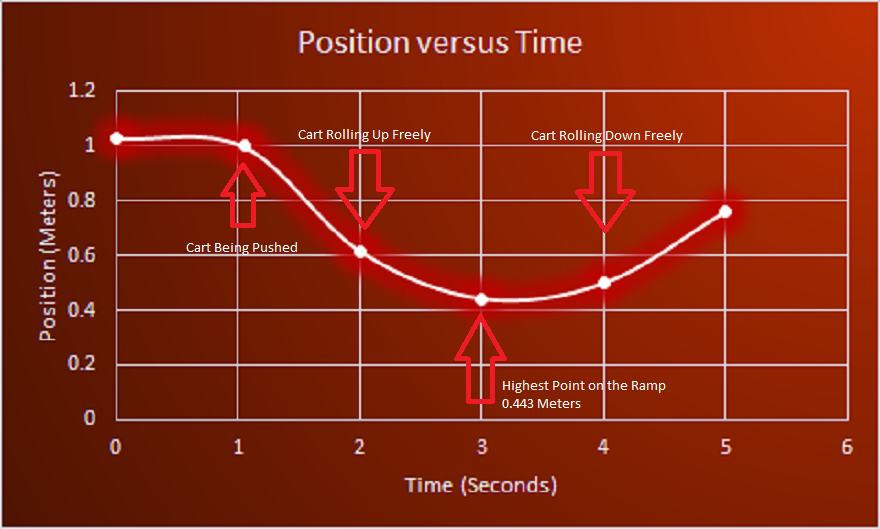
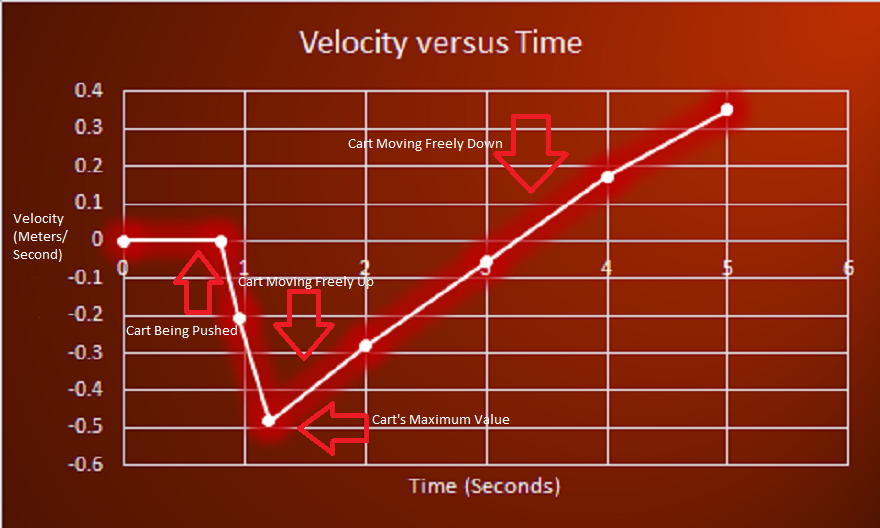
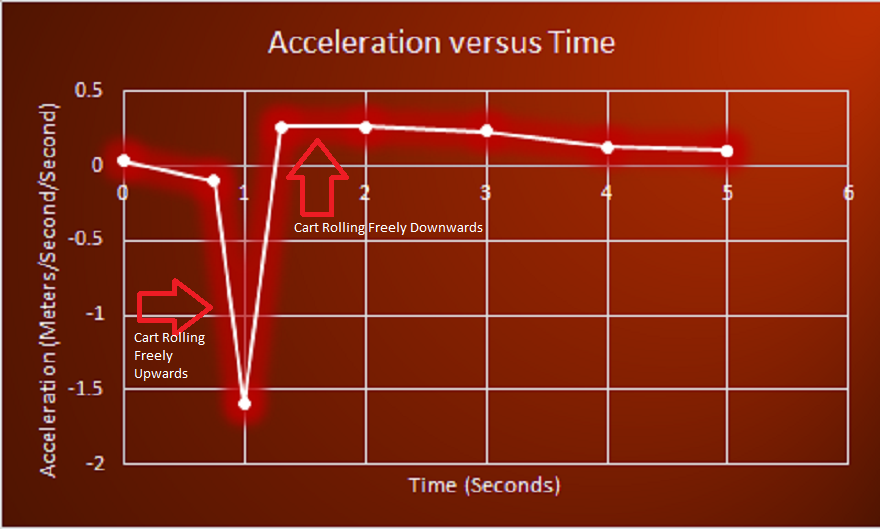
Here are the actual results:
COMPARING THE PREDICTIONS TO THE RESULTS:
-The Position versus Time Graphs were overall very similar. They were both parabolas - lines that take a "U" shape.
-The Velocity versus Time Graphs were similar as well. They both sharply dipped into the negative zone before rising to a positive velocity.
-The Acceleration versus Time Graphs were different. In my prediction, everything remained in the positive area. However, there was actually a brief period of time when the acceleration was negative. Also, in the prediction there was a moment of absolutely no acceleration. There was also acceleration in the actual experiment.
This is the equation I found:
y = 0.22823x - 0.7507
conclusions
I went into this lab looking for the distance, velocity, and acceleration of a gently pushed cart rolling up and down a ramp. I did it.
#1 How closely does the slope correspond to the acceleration you found?
I had to find the slope of the velocity graph. Seemed easy enough. But I also had to find the acceleration, which I had never done before. Little did I know that they were the same thing! The slope of the equation above (0.22823 m/s/s) is almost identical to the acceleration value (0.233 m/s/s). With a little rounding, they could be the same number. In other words, if you consider the margin for error, the acceleration value and the slope of a velocity graph you get from the same trial are supposed to be the same number.
#2 What was the velocity of the cart at the top of its motion?
The cart did not have a velocity at this point.
#3 What was the acceleration of the cart at the top of its motion?
The acceleration was 0 m/s/s.
#4 Is the cart's acceleration constant during the free-rolling segment?
Yes - the numbers aren't 100% constant, but they're very close, so the acceleration, if it was actually changing at all, changed a very, very, VERY small amount.
#5 Review your preliminary questions. Based on your new knowledge, do you still agree with your prediction? Why or why not?
Well, I got into this in the Predictions, Data, and Analysis section. Overall, yes, but I did make a few mistakes. My prediction of the Position v. Time Graph was certainly more dramatic than what actually happened. As for the Velocity v. Time Graph, my guess was a lot neater than actually occurred - while mine looked like a perfect check-mark, the results were a little more dramatic and a lot less neat.
I could NOT have been ANY more off with my predicted Acceleration v. Time Graph. It's just not possible. My acceleration remained in the positive zone constantly (something acceleration does not naturally do), and I just didn't get the rolling freely downwards segment correct.
IN SHORT, I agree with my first two predictions overall, but strongly disagree with my predicted Acceleration v. Time Graph.
#6 Explain what the meaning of the equation that you found for the velocity time graph. Label each variable and explain what the meaning of the slope is.
If you don't remember, the equation in question is as follows:
y = 0.22823x - 0.7507
This equation shows you how to find the velocity of the cart at a certain point in time. Here's the equation broken down:
y = the y-value. It's the velocity of the cart (or another object) at a certain point in time. It's also what you're looking to find in the equation, generally, anyways.
x = the x-value. It's the time you're trying to calculate the velocity for. In other words, if you're trying to find the velocity at three seconds three seconds is your x-value.
0.22823 = the slope. The slope of a velocity v. time graph means the acceleration. It shows by how much the velocity of the cart is increasing each second, hence meters per second per second.
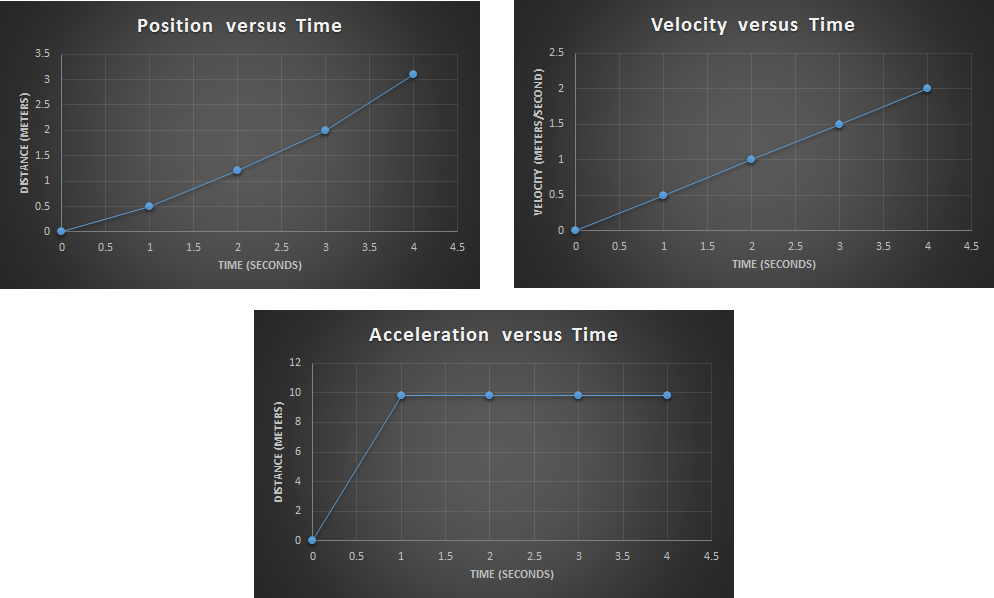
#7 Predict what the position vs. time, velocity vs. time, and the acceleration vs. time would be for an object that was falling straight down, rather than being on an incline.
Well, I've actually had to do this experiment (see Picket Fence Free Fall for more information). But, to be fair, I won't be setting up those graphs as my predictions.
Here are my best guesses:
#1 How closely does the slope correspond to the acceleration you found?
I had to find the slope of the velocity graph. Seemed easy enough. But I also had to find the acceleration, which I had never done before. Little did I know that they were the same thing! The slope of the equation above (0.22823 m/s/s) is almost identical to the acceleration value (0.233 m/s/s). With a little rounding, they could be the same number. In other words, if you consider the margin for error, the acceleration value and the slope of a velocity graph you get from the same trial are supposed to be the same number.
#2 What was the velocity of the cart at the top of its motion?
The cart did not have a velocity at this point.
#3 What was the acceleration of the cart at the top of its motion?
The acceleration was 0 m/s/s.
#4 Is the cart's acceleration constant during the free-rolling segment?
Yes - the numbers aren't 100% constant, but they're very close, so the acceleration, if it was actually changing at all, changed a very, very, VERY small amount.
#5 Review your preliminary questions. Based on your new knowledge, do you still agree with your prediction? Why or why not?
Well, I got into this in the Predictions, Data, and Analysis section. Overall, yes, but I did make a few mistakes. My prediction of the Position v. Time Graph was certainly more dramatic than what actually happened. As for the Velocity v. Time Graph, my guess was a lot neater than actually occurred - while mine looked like a perfect check-mark, the results were a little more dramatic and a lot less neat.
I could NOT have been ANY more off with my predicted Acceleration v. Time Graph. It's just not possible. My acceleration remained in the positive zone constantly (something acceleration does not naturally do), and I just didn't get the rolling freely downwards segment correct.
IN SHORT, I agree with my first two predictions overall, but strongly disagree with my predicted Acceleration v. Time Graph.
#6 Explain what the meaning of the equation that you found for the velocity time graph. Label each variable and explain what the meaning of the slope is.
If you don't remember, the equation in question is as follows:
y = 0.22823x - 0.7507
This equation shows you how to find the velocity of the cart at a certain point in time. Here's the equation broken down:
y = the y-value. It's the velocity of the cart (or another object) at a certain point in time. It's also what you're looking to find in the equation, generally, anyways.
x = the x-value. It's the time you're trying to calculate the velocity for. In other words, if you're trying to find the velocity at three seconds three seconds is your x-value.
0.22823 = the slope. The slope of a velocity v. time graph means the acceleration. It shows by how much the velocity of the cart is increasing each second, hence meters per second per second.
#7 Predict what the position vs. time, velocity vs. time, and the acceleration vs. time would be for an object that was falling straight down, rather than being on an incline.
Well, I've actually had to do this experiment (see Picket Fence Free Fall for more information). But, to be fair, I won't be setting up those graphs as my predictions.
Here are my best guesses: